Boat

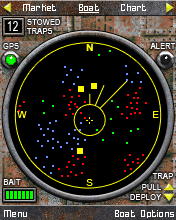
In the Boat view, you can deploy and pull traps.
Fish appear as colorful moving blips. You
can see the different species, their locations, and their current
population levels.
The smaller yellow circle is your trap
pulling range. The small "+" inside the circle shows your current location. The three "whisker" lines indicate your
changing walking direction. You
collect fish by walking to fish schools' real-world
locations and deploying traps there. Deployed traps appear as yellow
squares. |
Chart

In the Chart view, you can see your
real-world walking path and the traps you have deployed. White regions show where you have walked while playing the game.
Your
current location is indicated by the black square.
Deployed
traps are shown as colored squares.
Gray gridlines help you estimate
distances. Each square contains 25 fishing regions (5 x 5).
Walking briskly, a can traverse five fishing regions in less than
two minutes. |
Market

In the Market view, you can check your
bank balance and the value of your inventory at current market
prices. You can also monitor fish prices, and
sell fish when the price is right. Fish prices change every six hours.
The graph shows
a three-day price history for the selected species. In the
example above, prices for Ruby Clowns are currently on an upward
trend.
|